Class Distribution
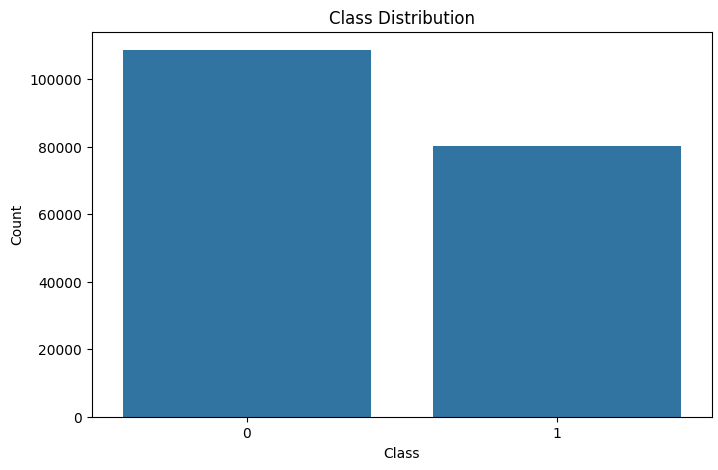
This chart visualizes the distribution of benign (Class 0) and attack (Class 1) samples in the dataset.
Key Observations:
- Class 0 (Non-Attack): Represents normal operations, and has a higher count.
- Class 1 (Attack): Represents intrusion or malicious activities, and has a lower count.
The imbalance indicates that there are significantly more benign samples than attack samples, reflecting real-world IoMT network traffic.
Implications:
The imbalance could lead to bias in the model. Strategies like class-weighted loss, oversampling, or undersampling will help in improving the detection of minority class attacks (Class 1).
Feature Distributions
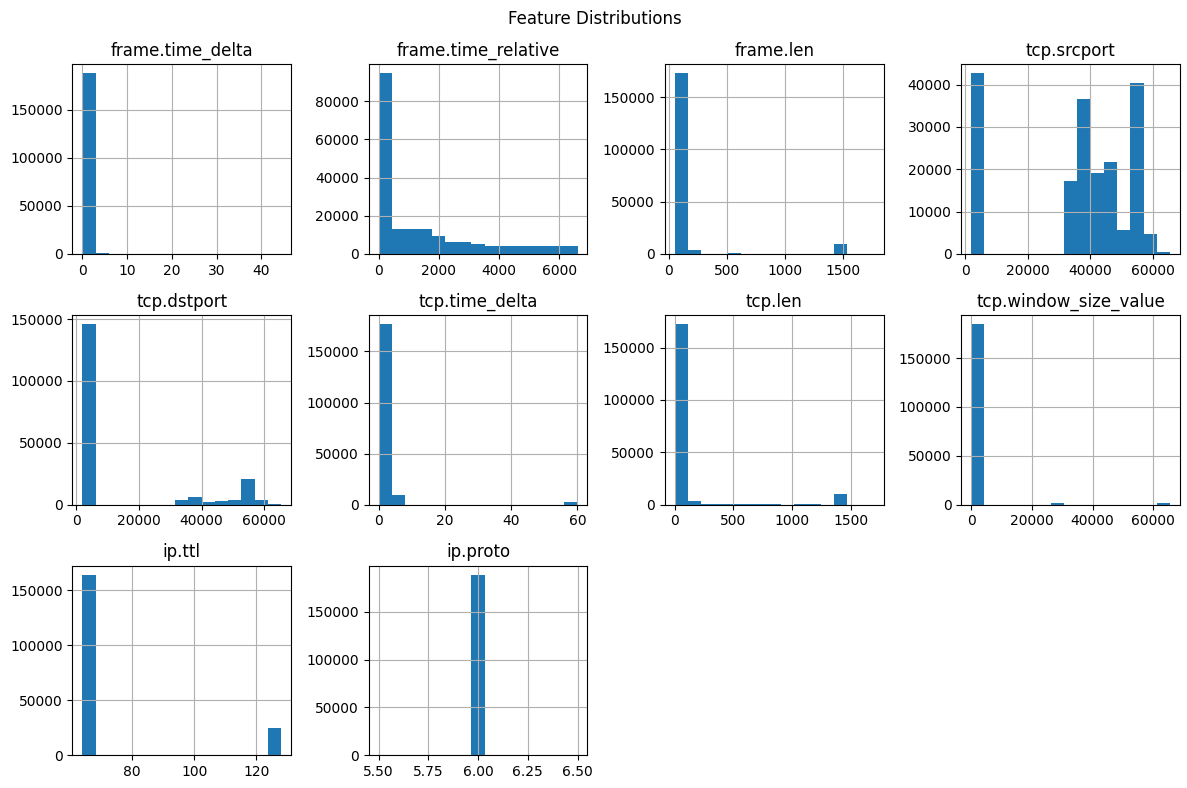
This visualization displays the distributions of various numerical features in the dataset.
Key Observations:
- Skewed features like frame.time_delta and tcp.time_delta suggest rare or specific patterns in network traffic.
- Multimodal distributions in tcp.srcport and tcp.dstport might reflect different types of network activities.
- Minimal variation in ip.proto indicates the dominance of a single protocol (likely TCP).
These distributions highlight the importance of preprocessing steps like normalization to ensure balanced feature scaling during model training.
Relevance:
This analysis supports the feature extraction and preprocessing methodology described in FYP proposal. Properly scaled and processed features will improve the performance of intrusion detection models, especially CNN-BiLSTM and GRU architectures.
Feature Correlations
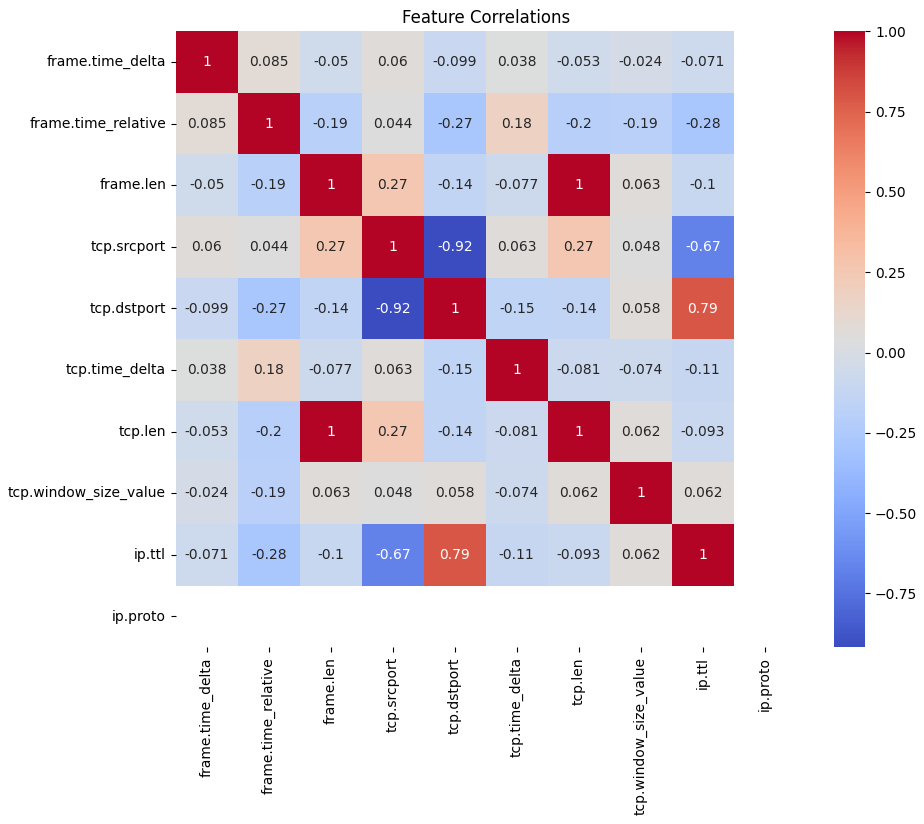
This heatmap illustrates the relationships between numerical features in the dataset.
Key Observations:
- Strong Negative Correlation:
tcp.srcport and tcp.dstport (-0.92) indicate an inverse relationship between source and destination ports.
- Strong Positive Correlation:
ip.ttl and tcp.dstport (0.79) suggest related behavior between packet time-to-live and destination ports.
- Weak or No Correlation: Features like
frame.time_delta and tcp.len are mostly independent.
These correlations guide feature selection and preprocessing, ensuring the dataset is optimized for training.
Relevance:
The heatmap supports the feature extraction phase outlined in FYP proposal. Highly correlated features may be removed or transformed, simplifying the intrusion detection models.
Federated Training Accuracy
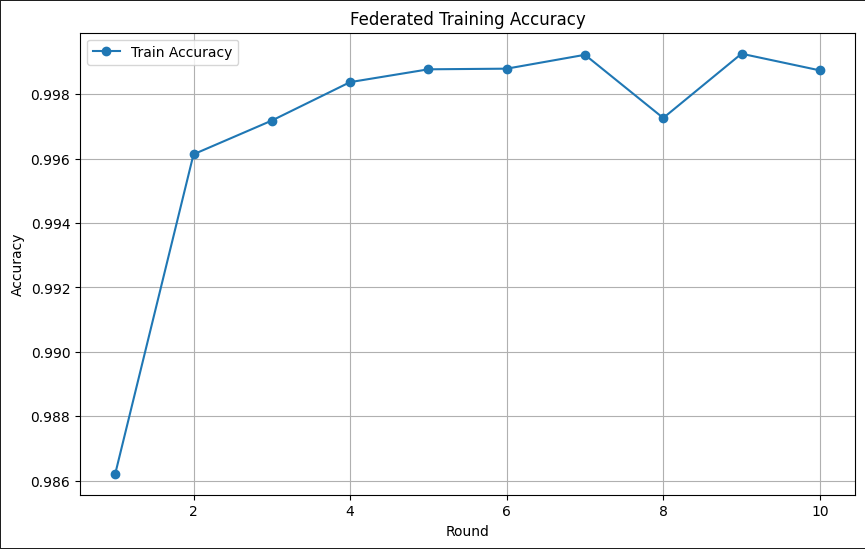
This plot shows the improvement in training accuracy over 10 rounds of federated learning.
Key Observations:
- The accuracy rapidly increases during the initial rounds, indicating effective learning from distributed data.
- Stabilization above 0.998 suggests the model has converged.
Relevance:
The results validate the federated learning approach, as highlighted in the FYP proposal. It ensures efficient model training without centralizing sensitive IoMT data.
Federated Training Loss
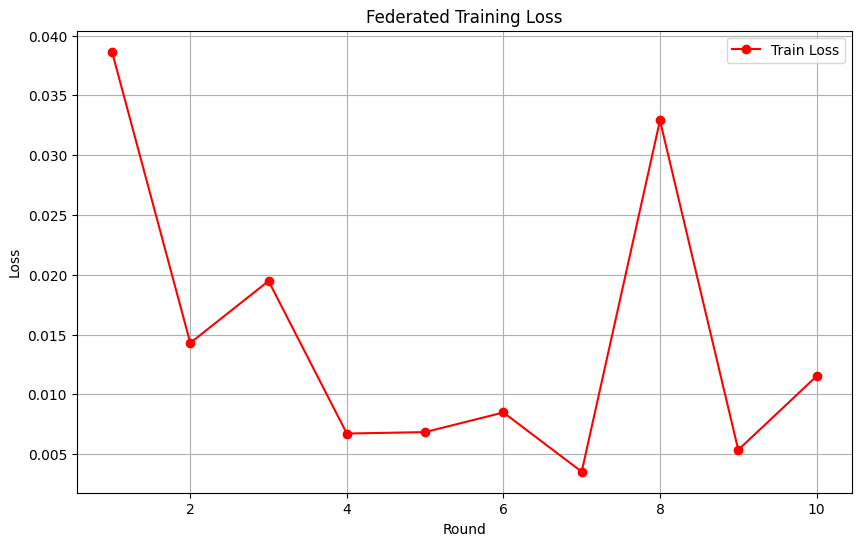
This plot tracks the training loss over 10 rounds of federated learning.
Key Observations:
- The loss starts high (~0.04) and rapidly decreases, showing effective learning.
- A small spike at round 8 reflects the dynamic nature of federated learning updates.
- The overall trend demonstrates the model's ability to minimize loss and adapt to distributed IoMT data.
Relevance:
This trend supports the federated learning approach outlined in FYP proposal. The decrease in loss over rounds highlights the model's effective optimization and adaptability.